Posted On July 20, 2020
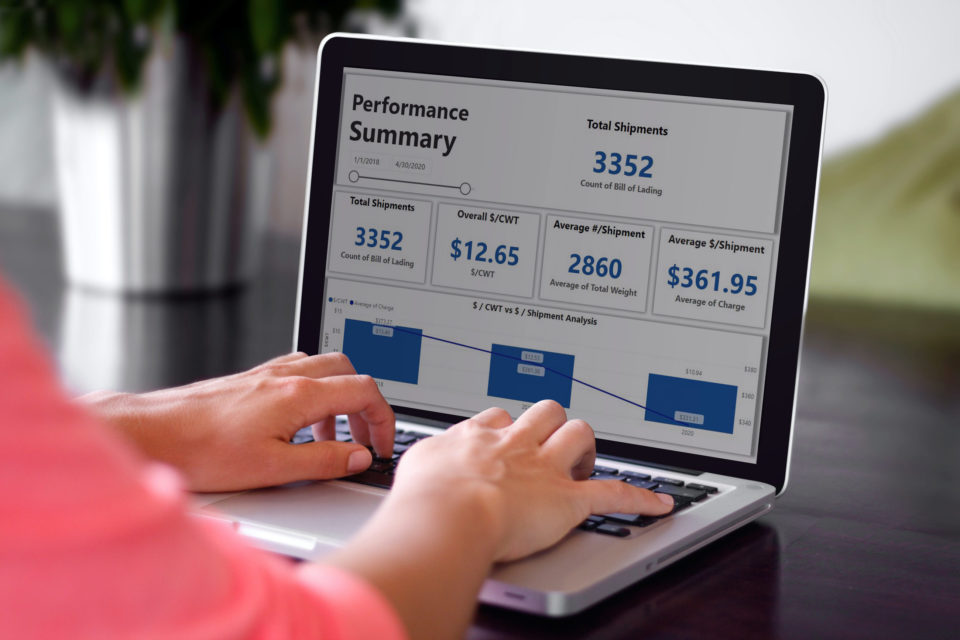
Supply chain data takes the guesswork out of transportation logistics.
With thousands, millions or even billions of data points, businesses who utilize supply chain data are able to predict outcomes, avoid issues and respond to problems more effectively. In a nutshell, data can help companies operate faster, smoother and more cost-efficiently.
But just because a company has access to its supply chain data doesn’t mean all of its problems are immediately solved. We often hear from companies who don’t know how to interpret their data or don’t trust its accuracy enough to base decisions off of it. And anyone who’s ever had a giant Excel document crash knows that data overload is a real thing.
So we’re sharing some tips on how to get the most out of your company’s supply chain data.
Focus on the data that’s right for your company.
Some metrics are universal. Any business with a supply chain should be tracking things like overall transportation costs or average shipment time.
But beyond the basics, it’s important to focus on the key performance indicators, or KPIs, that best suit your company. If tracking something doesn’t benefit your business, stop worrying about tracking it, and vice versa—if there’s something your company could benefit from monitoring, look into ways to make it happen.
For example, Flat World works with a company that uses fabric in its manufacturing. Because shipping costs affect the company’s profitability, they wanted to track the price to ship fabric per yard. So we added this data field from them inside our TMS (or transportation management system) software to make it possible. By thinking outside of the typical metrics, our client is now able to monitor the costs.
Keep your data fresh.
Greek philosopher Heraclitus said, “The only constant in life is change.”
Heraclitus probably wasn’t thinking about supply chains and transportation when he said it, but it still applies. So don’t rely on data from years past to make decisions today.
Often, companies operate a certain way based on five-year-old data. And that was smart five years ago. But it’s possible that variables have changed since then, meaning the current solution might not still be the best. Use the new data you have to confirm that your company’s practices are still ideal, or to discover better ways of doing things.
For example, it used to be sound advice to ship anything under 150 pounds as parcel, and anything over 150 pounds via less than truckload (LTL). But with newer density-based and cube-based pricing programs offered by both parcel and LTL carriers, following that rule now would be very costly for high-volume shippers.
Don’t make unfair comparisons.
But wait! Don’t throw out your old data just yet.
Historical metrics are good to have for comparison and benchmarks. We encourage clients to look at year-over-year and month-over-month comparisons to identify patterns and trends.
However, keep in mind any big changes that may have influenced a shift in numbers, like major changes in client or supplier base (origins or destinations), commodity mix changes, and increases in carrier costs. Understanding historical changes will prevent you from comparing apples and oranges.
Looking at shipping costs per client as a percentage of sale is a great way to identify which clients and what types of orders are making the most profit. As order sizes change (for example, with free shipping promos), profits will change as well. Understanding how shipping charges impact specific clients’ profitability is great historical data you can use to better position your company for future growth initiatives and profit improvements.
Use the right tools for the job.
You wouldn’t try to cut down a tree with a hammer or bake a cake using chopsticks. Doing so would be inefficient and costlier in the long run.
In the same way, it’s important to have the right tools to track supply chain data.
Most manufacturers use Excel or an ERP (Enterprise Resource Planning) to track data and get more visibility into their operations. Both are great tools—but they can’t do everything.
A TMS integrates with ERPs and computes additional information to increase efficiency and cut costs. Like other tools, using a TMS requires an investment, but the cost savings make it more than worth it.
Get a little help from your data friends.
Whether you’re concerned about the integrity of your data or just don’t know exactly how to interpret it, getting a second set of eyes can help. That’s one of the reasons we meet with clients for quarterly reviews, so we can try to spot anything they may have missed.
It’s ok to rely on your logistics partners for insights, or to ask teammates to help you identify patterns. When it comes to supply chain data, the more minds the merrier.
We hope this helps clarify ways you can use your supply chain data to improve your business. If you’ve learned other strategies, or have questions about your data or analytics tools, reach out! We’d love to talk to you.

