Posted On May 2, 2022
There’s meaning in the metrics.
Whatever a company’s goal—from improving inventory management and streamlining their supply chain to meeting customer demands to increasing gross profit—the answer often lies in its supply chain KPIs.
What are supply chain KPIs?
Supply chain KPIs, or key performance indicators, are metrics that measure supply chain performance. Supply chain management teams can use the data to gauge the speed, efficacy, efficiency and cost of everything supply chain related, from sourcing and manufacturing to inventory, distribution and transportation. By tracking supply chain metrics, teams can optimize their existing processes and make better business decisions related to their supply chains.
So what metrics should your business be tracking?
Common supply chain metrics
Important key performance indicators to track will vary from company to company, based on business goals and needs. For example, one of Flat World’s clients uses bolts of fabrics in their manufacturing process. In addition to knowing the cost of shipping each bolt of fabric, the client asked us for help in calculating the transportation cost per yard of fabric. That’s not a common supply chain KPI, but one that was important to the ensuring optimal supply chain management. KPIs also continuously evolve as customer demand, technology and industry standards change. So, in addition to some of the common KPIs outlined below, think about what non-standard supply chain metrics that would be helpful for your company to track.
Freight cost
While straightforward, freight cost is one of the most critical supply chain KPIs for keeping total supply chain costs low. It simply measures total freight bills for both inbound and outbound freight. Like the example above, freight cost can be broken down several ways, including freight cost per pound or freight costs as a percent of sales.
Freight bill accuracy
Many companies take the accuracy of their freight bills for granted—or simply don’t make the time to evaluate whether they’re receiving correct freight bills. Tracking this metric (which can be done as part of ongoing freight audits) helps supply chain management teams recoup unnecessary spending and spot trends.
Average loading and unloading times
When a shipment is on the dock, either being loaded or unloaded, speed is vital. Of course, outbound shipments need to be leaving the dock in a timely manner to ensure on-time delivery, but there’s an added cost factor, as well.
When drivers have to wait extra time while goods are being loaded or unloaded, carriers typically charge dwell fees. Measuring average loading or unloading times (the time in hours it takes to load or unload freight) helps companies determine the risk—and therefore prevent—dwell times and dwell fees.
Receiving efficiency
Once you know the average time teams spend to unload a shipment, you can establish a benchmark for receiving efficiency—or the productivity of warehouse employees on the receiving dock. Low receiving efficiency numbers can indicate a need for more trainings or streamlined supply chain processes.
To calculate: Divide the volume of inventory received by the number of staff hours worked
Customer order cycle time
After items have been received and placed on shelves, the next area companies should evaluate is order fulfillment—and according to modern customer demand, the faster, the better. Customer order cycle time measures the length of time that passes between when a purchase order is placed (also called the purchase order creation date) and the actual delivery date.
Fast delivery times correlate to increased sales and strong customer satisfaction, so finding ways to decrease the customer order cycle time is important for both customer acquisition and retention.
To calculate: Calculate the difference between the delivery date and the purchase order creation date
Pick and pack cycle time
This metric measures order fulfillment, starting from the time an employee pulls items from the shelves until items are packaged, labels and ready for transportation.
Fill rate
One of the most important ways to evaluate supply chain performance, fill rate is the percentage of shipments that are successfully completed shipped on the first attempt. This supply chain KPI helps companies spot issues with inventory and backorders as well as gauge customer satisfaction.
There are several ways to calculate fill rate, including item fill rate, order fill rate and unit fill rate.
On-time shipment rate
As the name suggests, on-time shipment rate calculates the percent of orders that are shipped (or picked up by the carrier) on-time. Note the italics, because this supply chain KPI is distinct from on-time delivery rate, and shouldn’t be confused.
To calculate: Divide the number of on-time shipments by the number of overall shipments
On-time delivery rate
Just because an order leaves the warehouse in a timely matter doesn’t necessarily mean it will make it to its final destination that way. On-time delivery calculates the percent of orders delivered by or before the promised delivery date. Evaluating on-time delivery rate by carrier allows shippers to evaluate carrier efficiency. If a company needs to improve its customer satisfaction levels, on-time delivery rate is often a good place to start.
To calculate: Divide the number of on-time deliveries by the number of overall shipments
Damage rate
Unfortunately, damage is never completely avoidable in supply chain operations. But that doesn’t mean shippers can’t still work to minimize it. Damage rate measures the percent of delivered orders that contained damaged goods. A high damage rate can indicate several possibilities, including the need for improved packaging or switching carriers.
To calculate: Divide the number of deliveries containing damaged goods by the number of overall shipments
Perfect order rate
A high perfect order rate is the Mount Everest of supply chain management. This supply chain KPI measures the percentage of orders that are delivered in-full, on-time and without errors. Potential errors that could detract from this rate include delays, damaged goods, incorrect fulfillment, delivery to the wrong address or a lack of documentation.
To calculate: Divide the number of orders with errors by the total number of shipments
Inventory velocity/inventory turnover
Inventory velocity, also called inventory turnover or inventory turnover ratio, measures the speed at which inventory is stocked and sold. A low inventory turnover ratio suggests goods aren’t selling quickly enough.
To calculate: Divide the cost of goods sold by the average inventory on hand
Supply chain costs
A profitable business needs to keep supply chain costs manageable. This KPI can be broken down numerous ways, but a high-level number is important for comparing against sales numbers.
To calculate: Divide the total amount of money spent on supply chain costs by the total sales for the same period
Extracting information from your key performance indicators
Having supply chain data is one thing—but turning that data into actionable insights for your supply chain operations takes both powerful technology and data expertise. Here are some things to keep in mind when reviewing your key supply chain metrics:
Prioritize data accuracy
As the saying goes, garbage in, garbage out. If the analytics you’re reviewing aren’t accurate, then the story they tell won’t be accurate, either. Before trying to evaluate your supply chain performance based on the numbers, take a look at the numbers themselves, and do any necessary data cleansing. Our data analysts regularly review client data, looking for outliers and inaccuracies caused by human error in manual data entry (yet another reason why automation is vital to a successful supply chain.)
Consider historical context
Here’s the thing most people forget about supply chain data: it’s all from the past.
When comparing today’s data with last month’s (or last year’s) analytics, it’s important to consider the context of what else was occurring that could have positively or negatively affected supply chain responsiveness and performance. For example, bad weather may have wreaked havoc on last spring’s delivery times. If you forget that in your monthly analysis of year-over-year performance, you might come to the conclusion that your company has vastly improved its delivery times. You’d be wrong. Hopefully, you wouldn’t base any decisions off of that conclusion.
Try as we might, there are just some things that companies and individuals can’t control. Current fuel rates are a great example. While most companies have little power over rising fuel costs, including the going rate as part of your supply chain analysis can give context as to why some numbers and costs might be higher than usual.
Timing is everything
Some supply chain KPIs need to looked at week-over-week, while other metrics should be compared to previous years. Different views of data will lead you to different conclusions about whether yours is an efficient supply chain. That’s why it’s important to be able to evaluate data through different timeframes and views, from a granular perspective to a high-level overview, to ensure you’re extrapolating the right information. This is especially important for companies with strong seasonality changes.
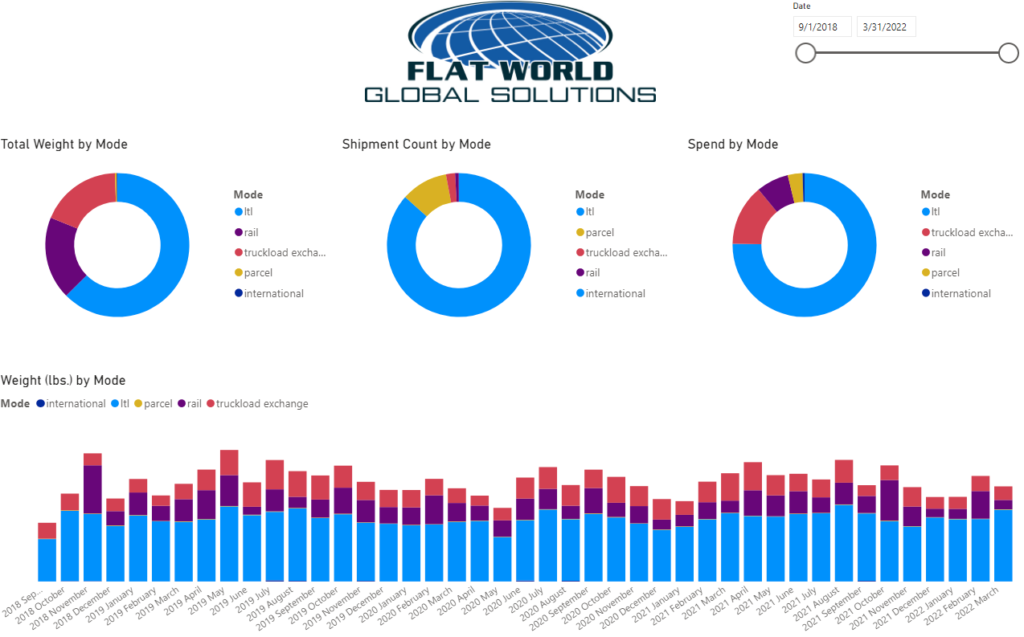
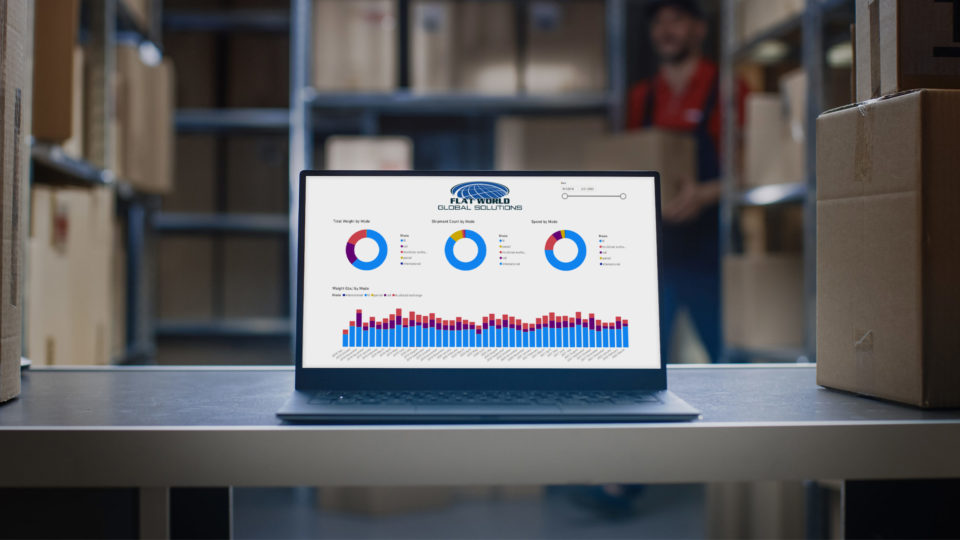
Behold the supply chain KPI dashboard
The best way to monitor supply chain performance and view all of your metrics in one place is a supply chain KPI dashboard.
A dashboard is either an at-a-glance review of important supply chain metrics, usually with visualizations of the data to make understanding them quick and easy. Ideally, your supply chain technology has the capabilities to create supply chain dashboards—but as we’ve said before, not all supply chain technology is created equal.
Here are a few things to keep in mind when using technology to create dashboards:
- Supply chain data often comes from numerous sources, including e-commerce platforms, warehouse management systems (WMS), transportation management systems (TMS) and more. Many supply chain dashboard tools won’t be able to pull in data from outside sources, but some do, so consider what your company’s needs are.
- When evaluating data on a dashboard, will you want to be able to drill down deeper into data to find whatever metric or statistic you need? Some technology allows for exploration, but not all.
- Who needs to review the dashboards? Many leadership teams want to be able to view business intelligence tools like supply chain dashboards and make decisions based on them, so consider whether your dashboard technology needs to distributable to others on the team.
Using supply chain management data to inform business decisions
The beauty of data is just how many ways it can be used. Flat World clients often have specific questions that they need to find answers to in their data; other times, they spot trends or outliers in the data and can determine meaning from the metrics. Both strategies work, as long as your interpretations of the data are accurate.
But we do caution about making supply chain or business decisions based on your data if you’re not well-versed in analytics. It may help to think about supply chain analytics like the stock market and your 401k. You’d never want to make big changes to your 401k based on one bad day of trading on the stock market. Except for some specific instances, you probably shouldn’t make big decisions based on one day’s (or week’, or sometimes even a month’s) supply chain numbers.
If you have questions about supply chain analytics, supply chain technology or supply chain dashboards, let’s talk. Flat World’s proprietary technology gives companies better visibility into their supply chains, so you can make smarter, faster decisions and prepare for what’s ahead.